
Product Description
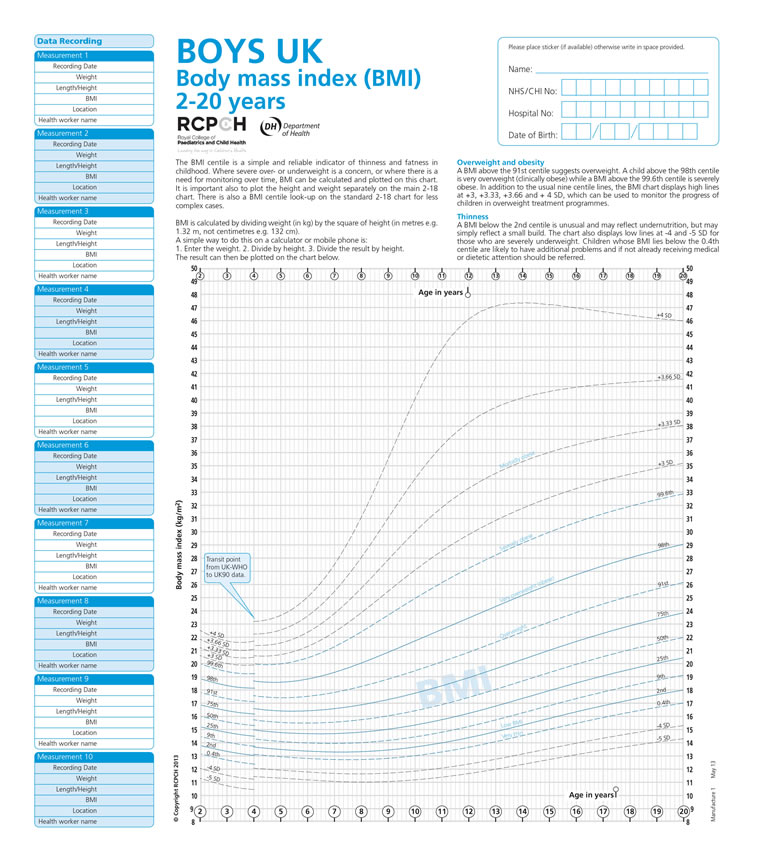
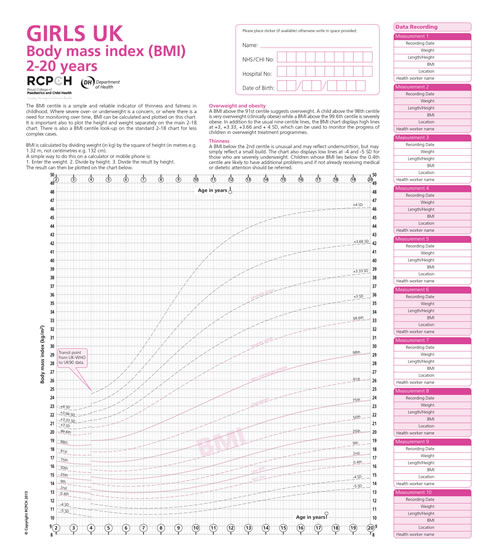
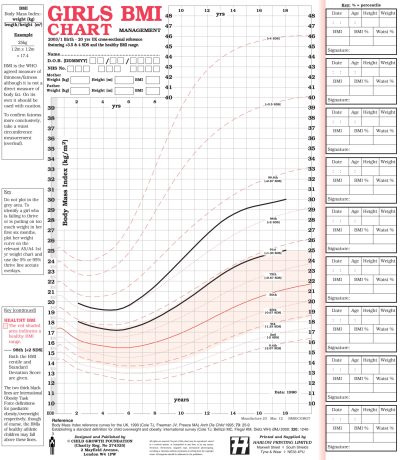
Body mass index (BMI) charts 2-20 years WHO 2-4/UK90 4-20
These have been developed alongside the CPCM charts and incorporate new centiles +3SD, +3.33SD, +3.66SD and +4SD above the normal 9 centiles. They also incorporate the -4SD and -5SD lines below the normal 9 centiles.
There are two charts on 1 document; 1 boys BMI chart & 1 girls BMI Chart, printed on the front and reverse respectively.
![A4 UK-WHO NICM [Neo-Natal Infant Close Monitoring] Growth Charts](https://www.hfacstaging.solidfiction.com/wp-content/uploads/2013/06/135557-GIRLS-NICM-Man-6-Apr.13_Page_1-400x265.jpg)
Reviews
There are no reviews yet.